IC Markets Home Sign in Web Trader Contact Us
IC Markets Social IC Markets Social

  • ABOUT US
  • OPEN LIVE ACCOUNT
  • OPEN DEMO ACCOUNT
  • TRADE NOW
  • VISIT OUR BLOG
IC Markets Social
  • ABOUT US
  • OPEN LIVE ACCOUNT
  • OPEN DEMO ACCOUNT
  • TRADE NOW
  • VISIT OUR BLOG
October 1, 2021North_American_Stocks_ptIC Markets

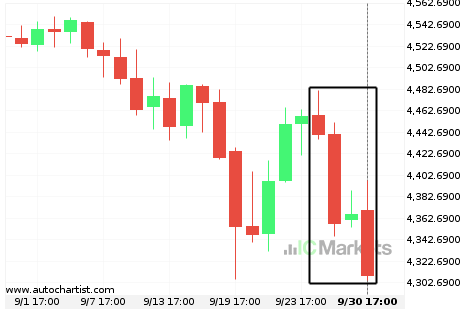
Grande Movimento US SPX 500 Index

US SPX 500 Index experimentou um 2.97% em baixa movimento no(a) último(a) 4 dias.

Read more
September 30, 2021North_American_Stocks_ptIC Markets

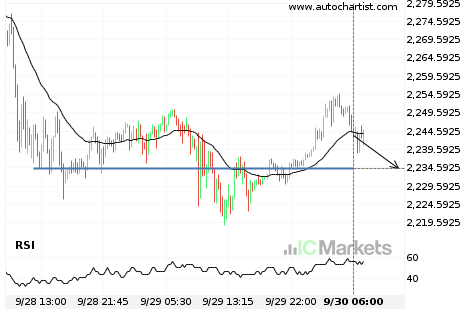
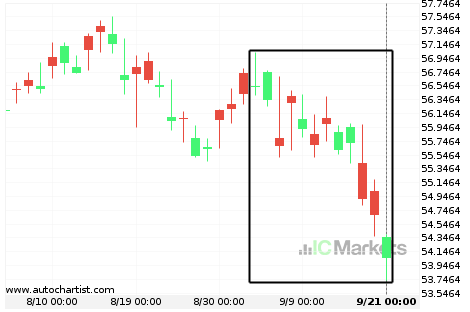
US Small Cap 2000 Index Nível visado: 2234.3999

Aproximando-Apoiar nível de 2234.3999 identificado em 30-set-2021 06:00 EDT

Read more
September 29, 2021North_American_Stocks_ptIC Markets

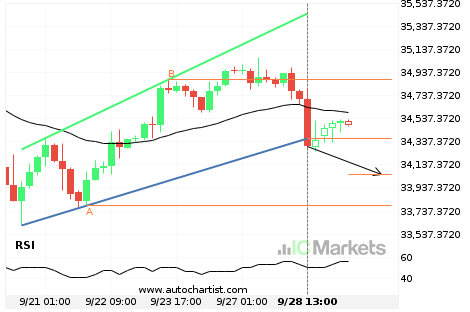
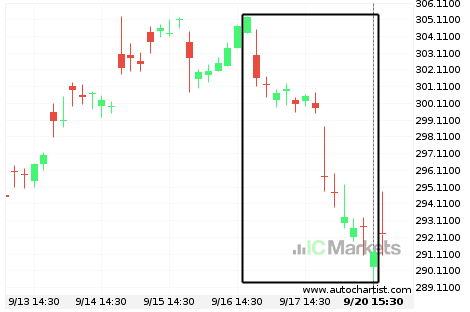
US Wall Street 30 Index Nível visado: 34054.5413

Canal ascendente quebrou na linha de suporte em 28-set-2021 13:00 EDT. Possível previsão de movimento em baixa nos próximos dia para 34054.5413

Read more
September 28, 2021North_American_Stocks_ptIC Markets

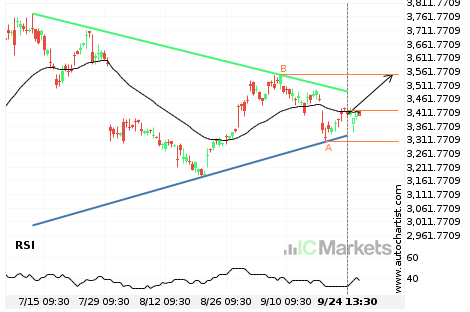
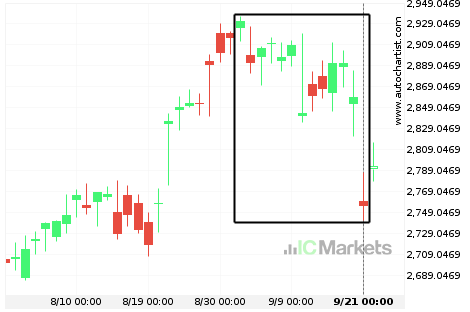
Amazon.Com Inc. Nível visado: 3549.9900

Triângulo identificado em 24-set-2021 13:30 EDT. Este padrão está ainda em processo de formação. Possível previsão de movimento em alta para o nível de 3549.9900 no próximo 3 dias.

Read more
September 27, 2021North_American_Stocks_ptIC Markets

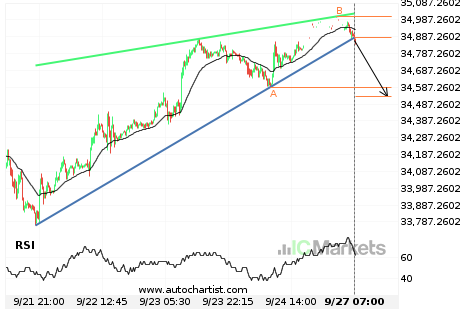
US Wall Street 30 Index Nível visado: 34531.5841

Cunha ascendente quebrou na linha de suporte em 27-set-2021 07:00 EDT. Possível previsão de movimento em baixa nos próximos dia para 34531.5841

Read more
September 24, 2021North_American_Stocks_ptIC Markets

Grande Movimento FACEBOOK

FACEBOOK experimentou um 10.2% em baixa movimento no(a) último(a) 22 dias.

Read more
September 23, 2021North_American_Stocks_ptIC Markets

Grande Movimento ALPHABET INC CLASS C

ALPHABET INC CLASS C experimentou um 6.03% em baixa movimento no(a) último(a) 20 dias.

Read more
September 22, 2021North_American_Stocks_ptIC Markets

Grande Movimento Coca-Cola Co.

Coca-Cola Co. experimentou um 3.84% em baixa movimento no(a) último(a) 19 dias.

Read more
September 21, 2021North_American_Stocks_ptIC Markets

Grande Movimento Microsoft Corporation

Microsoft Corporation experimentou um 4.6% em baixa movimento no(a) último(a) 96 horas.

Read more
September 20, 2021North_American_Stocks_ptIC Markets

Grande Movimento US Tech 100 Index

US Tech 100 Index experimentou um 2.27% em baixa movimento no(a) último(a) 76 horas.

Read more
  • 1
  • 2
  • 3
  • …
  • 71
  • 72
  • 73
  • 74
  • 75
  • 76
  • 77
  • …
  • 87
  • 88
  • 89

Recent Posts

  • Brent Oil vs US Dollar – نموذج الرسم البياني – قناة صاعدة
  • Brent Oil vs US Dollar – نموذج الرسم البياني – قناة صاعدة
  • Hong Kong 50 Index – نموذج الرسم البياني – مثلث صاعد
  • Hong Kong 50 Index – รูปแบบกราฟ – สามเหลี่ยมขาขึ้น
  • Hong Kong 50 Index – نموذج الرسم البياني – مثلث صاعد

Recent Comments

    Translation


     Edit Translation


    Forex Trading

    • Accounts Overview
    • Open an Account
    • Launch Web Trader

    Trading Specifications

    • Spreads and Commissions
    • Range of Market
    • Trading Hours
    • Funding
    • Withdrawal

    About IC Markets

    • Chat with a Specialist 24/7
    • Why IC Markets
    • Regulation
    • Legal Documents
    • Contact Us
    © 2022 Raw Trading Ltd | All rights reserved.
    • Sample Page